Diagnostics and Notifications
The webserver continuously samples system health and records diagnostic history. A diagnostics page surfaces live metrics, historical trends, and saved snapshots, while a toast notification system pushes transient alerts to every connected browser.
Diagnostics
The diagnostics subsystem tracks:
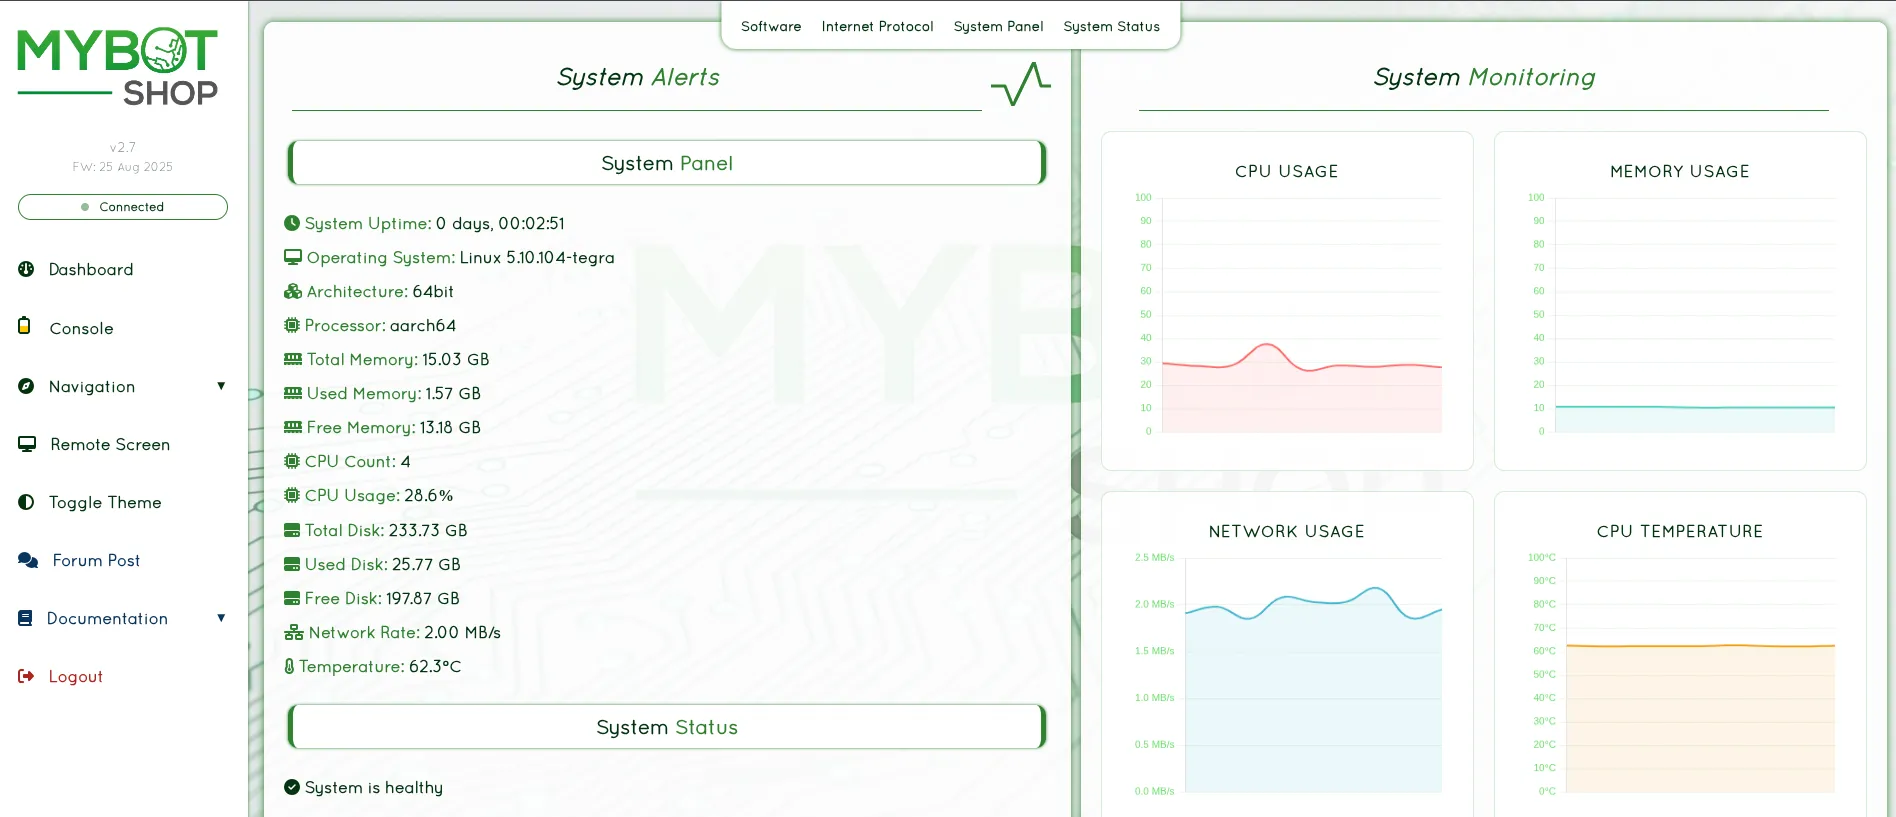
API request latency and error rate
CPU, memory, and disk utilization
ROS diagnostic status and fault reporting
Recent activity is held in an in-memory ring buffer, and periodic snapshots are persisted to disk so that history survives restarts. Snapshots are retained for a configurable number of days and bounded by a maximum disk budget.
Configuration
Diagnostics behavior is configured under the diagnostics key in
robot_info.yaml.
Key |
Default |
|---|---|
|
|
|
|
|
|
|
|
|
|
|
|
|
|
|
|
|
|
|
|
|
|
|
|
When a measured value crosses its threshold, the diagnostics subsystem flags the condition and can raise a notification.
Notifications
Toast notifications are short, transient messages delivered to all connected browsers over a server-sent event (SSE) stream. They are used for status changes, threshold breaches, and one-shot informational messages.
The notifications key in robot_info.yaml controls:
queue size
default display duration
severity colors and icons
Integration Endpoints
Endpoint |
Purpose |
|---|---|
|
Live metrics, history, snapshots, and configuration. |
|
SSE toast stream and notification pushes. |